Exciting news: Brizo FoodMetrics has been acquired by Datassential! Learn more.
As US tariff threats loom, waves of concern and speculation are rippling through the foodservice industry.
Will the proposed 25% tariffs on Canadian and Mexican imports — currently postponed to March 2025 — actually take effect? What about the recently announced “retaliatory tariffs” on global trading partners? One thing is certain: whether imposed or merely threatened, tariffs create uncertainty and stress for all industry players.
Instead of speculating, the best approach is to ground your decisions in data. With so much up in the air, anxious businesses need objective industry insights to understand what’s actually happening and plan for possible market shifts.
In this article, we’ll explore some practical ways to set aside speculation in favor of actionable analysis. We’ll cover some examples of how foodservice data and insights from Brizo FoodMetrics can answer questions both simple (like how many US establishments use avocado, a major Mexican export) and complex (using a simulator to model the impact of tariffs on menu prices and profitability).
If tariffs do come into play, the first step is understanding which ingredients and dishes would be most affected…and how many establishments are poised to take a hit.
In 2023, the US imported over $40 billion worth of Canadian agricultural products. Canola oil alone accounted for $4.8 billion — a staple in most commercial kitchens. Meanwhile, $1.6 billion of imported frozen potato products equals a lot of fries.
A quick data pull from Brizo FoodMetrics reveals that 379,000 US establishments feature fries on their menu, many likely deep-fried in canola oil. Though fries are typically a high-margin menu item, a 25% increase in supply costs would put additional pressure on a large number of operators.
What about the other half of the classic burger combo? It turns out that Canadian beef products account for $3 billion of annual US imports. With 246,000 establishments serving burgers in the US, will the industry’s recent focus on “value meal wars” remain sustainable in the face of tariffs?
Keep reading to see how our predictive model calculates the post-tariff price of a burger and fries.
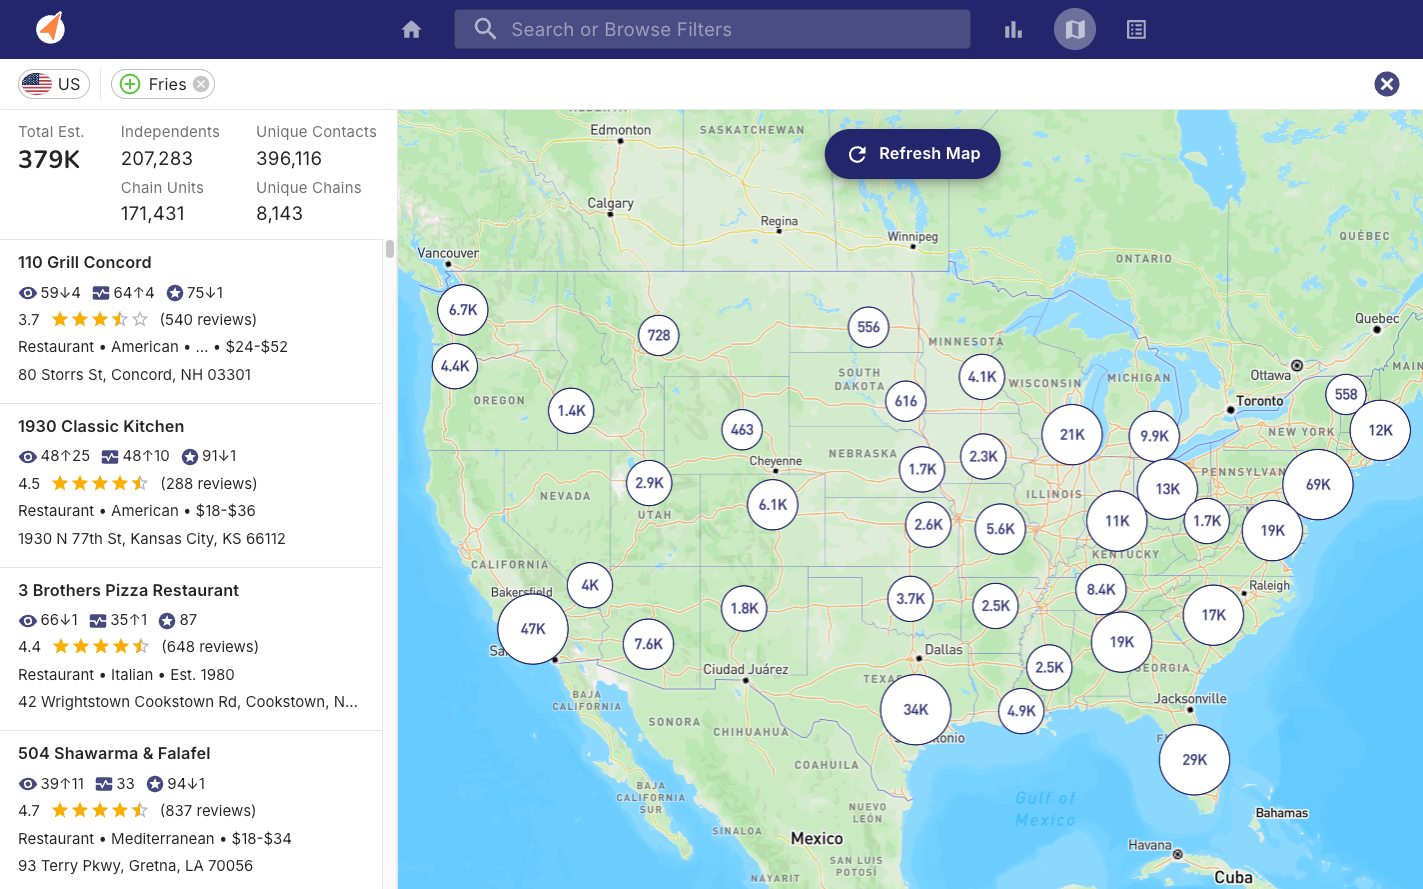
US establishments with fries on their menu. Source: Brizo FoodMetrics, February 2025
From avocado toast to guacamole, Americans consume a lot of avocados, and very few of them are grown domestically. Mexican avocados account for 89% of all avocados imported into the US. In fact, vegetables, fruit, beverages, and distilled spirits make up almost three quarters (72.5%) of US agricultural imports from Mexico.
It’s clear that tariffs on Canadian and Mexican imports would have a significant impact on US operators and consumers, but would that impact be evenly distributed? Do certain ingredients correlate more closely with specific cuisines, chains, or regions? Identifying these connections can help determine which segments are better (or worse) positioned to weather the tariff storm.
Detailed menu and business data from Brizo FoodMetrics can reveal existing patterns and groupings, offering a clearer picture of market volatility.
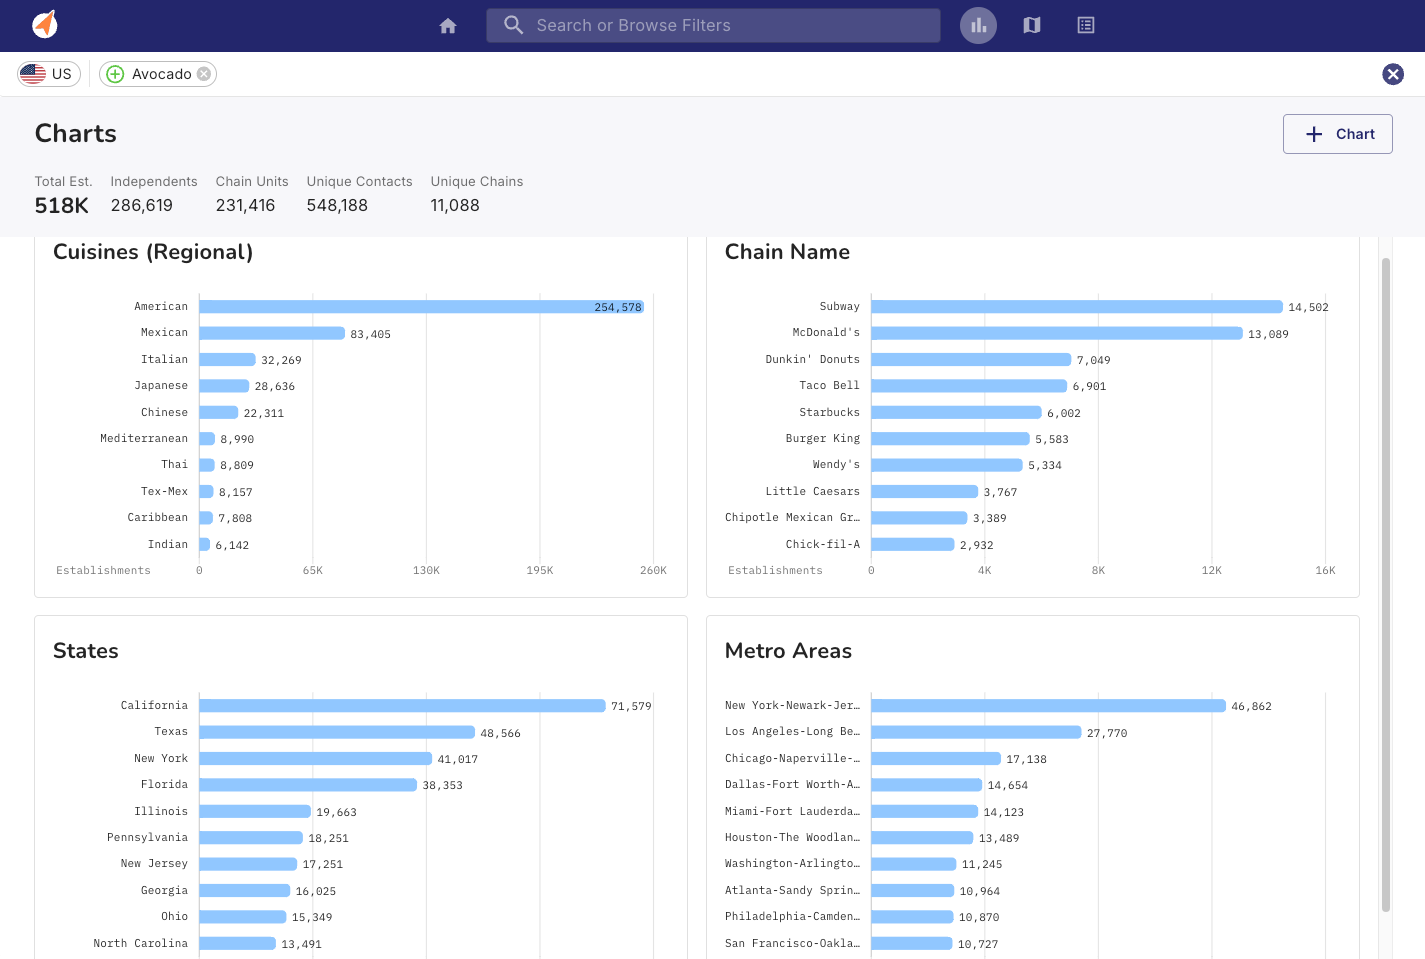
US establishments using avocado as an ingredient. Source: Brizo FoodMetrics, February 2025
Let’s take a closer look at US operators using avocado as an ingredient. Out of 518,000 establishments with avocado on their menu, 287,000 are independents, while 231,000 belong to chains.
Brizo’s chart view helps visualize which operator segments may be most affected by rising avocado prices. American and Mexican cuisines rely most heavily on avocados, with top chains like Subway, Taco Bell, and Chipotle reflecting this trend.
Geographically, California leads the states in avocado usage…no surprise there. But would you have guessed that New Jersey ranks seventh? Insights like these help identify where tariff impacts could hit hardest, allowing operators, manufacturers, and distributors to stay informed and ready to adapt.
So far, we’ve only scratched the surface with a few straightforward data points. The real power comes from combining these insights into a multi-dimensional, interactive model.
One approach we’ve been exploring is a tariff vulnerability index. Imagine a holistic scoring system and accompanying report highlighting specific risks and recommendations. Such a model would go beyond simple cost analysis to deliver a comprehensive risk assessment based on multiple market factors.
How can Brizo FoodMetrics data be leveraged to support this model? Here are a few key components:
If that sounds intriguing, read on to discover the first steps we’ve taken to build a price shock model you can try for yourself.
Whether you’re an operator, distributor, manufacturer, or industry analyst, you want to be adaptive, not reactive. Having a data-driven strategy will allow you to predict the future and stay ahead.
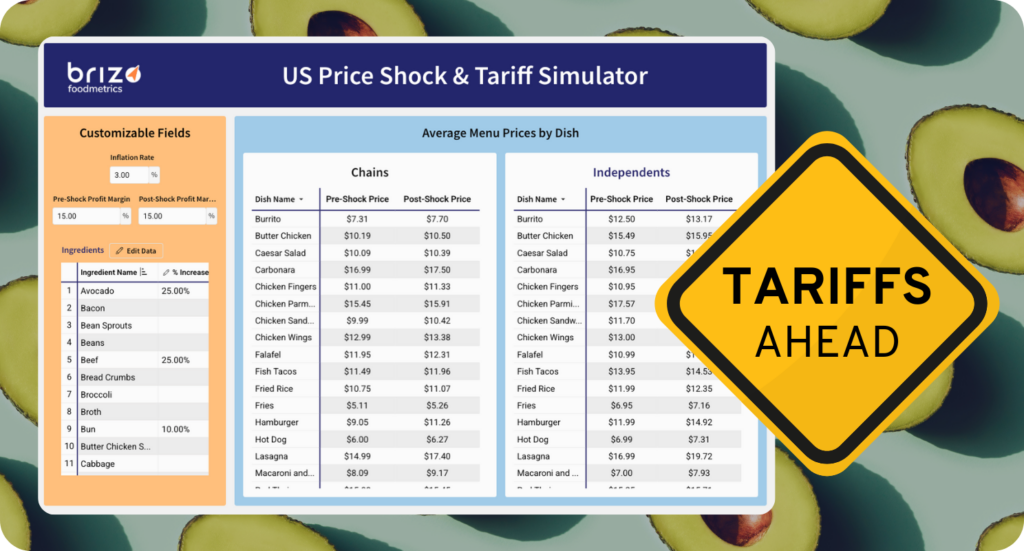
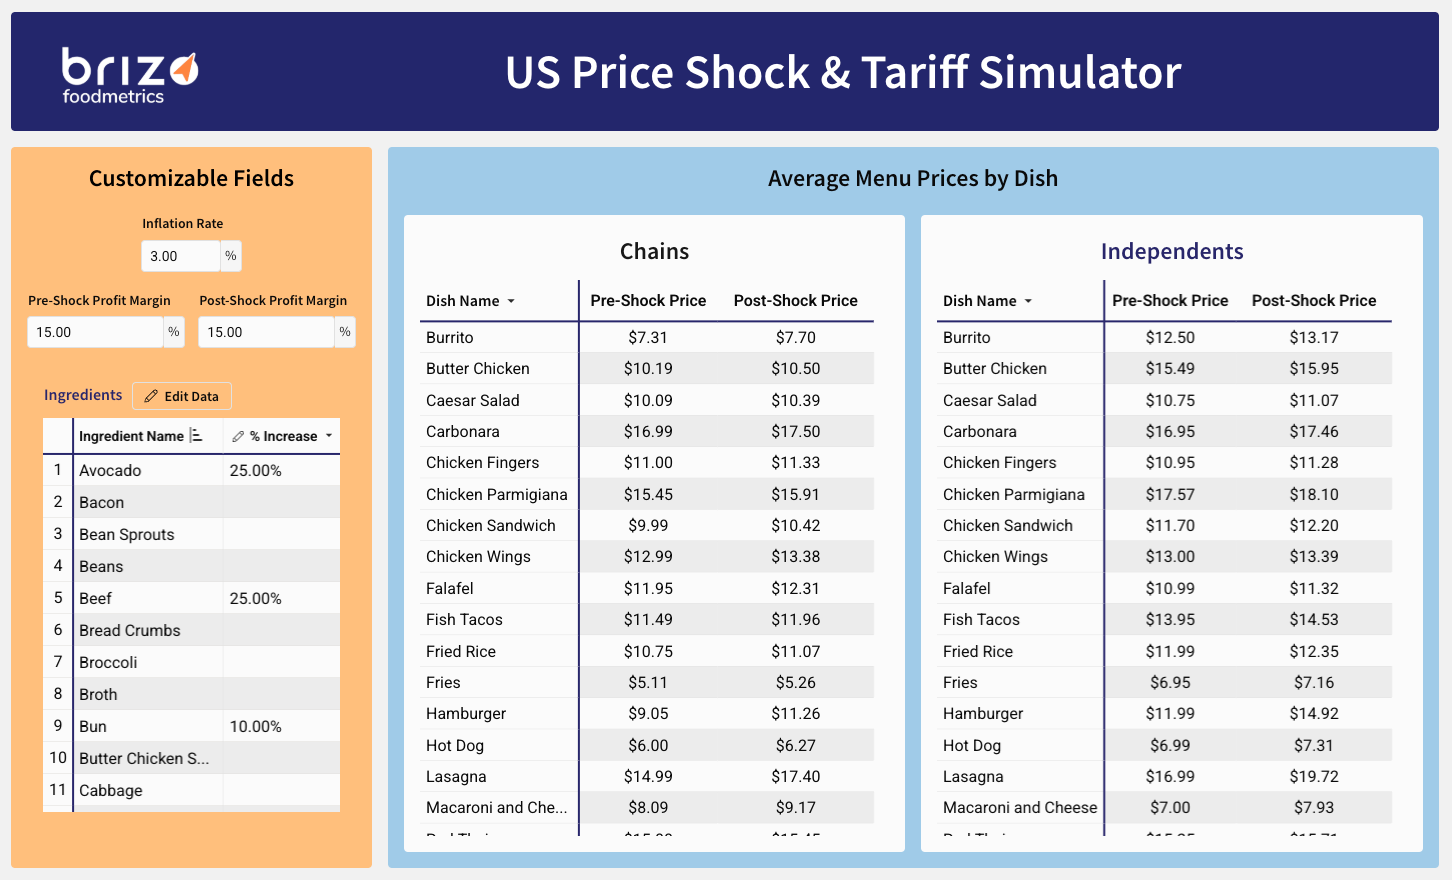
To support this, we’ve developed an interactive Price Shock & Tariff Simulator to calculate the potential impact of tariffs and other price shocks on menu pricing and profitability.
Source: Brizo FoodMetrics, February 2025
Our model allows you to analyze different dishes and their potential price fluctuations due to inflation and price shocks like tariffs, bird flu, minimum wage increases, and more. The primary columns (in blue) are:
A series of customizable fields (in orange) will dynamically update the Post-Shock Price for each dish, allowing any user to model different scenarios:
The model is possible thanks to a blend of Brizo’s proprietary foodservice data and practical AI usage. It takes into consideration:
Everything in the model is customizable: assisted by Brizo’s data & insights team, you can modify the underlying dishes, ingredients, cost ratios, and volumes to fit your needs. For companies looking to leverage AI, simply input your dish of choice into your preferred AI tool and ask it to deconstruct its ingredients by cost ratio and volume.
Even better, you can incorporate your own internal data for more precise forecasting and the ability to compare your business against an unbiased industry benchmark. Though the example simulator data is at a national level, the model can easily be customized to drill down to a specific region, business type, or market segment.
Imagine you’re a distributor of Canadian beef and Mexican tomatoes, about to speak with a large burger chain worried about the potential impact of tariffs. Understanding how sudden price shocks to the supply chain could affect their bottom line will empower you to guide the conversation and suggest strategic business decisions.
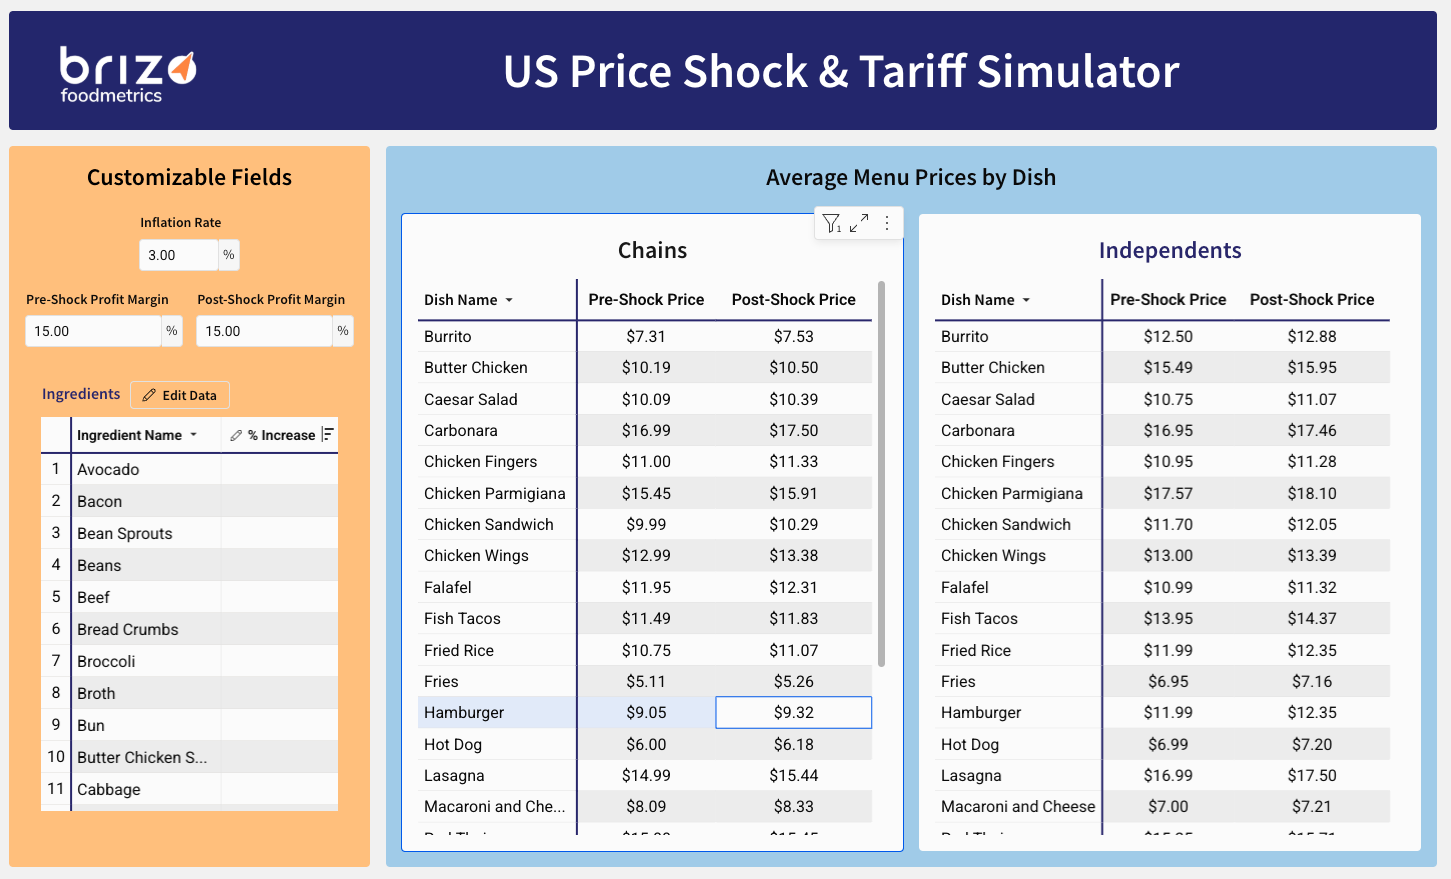
Scenario 1A: Hamburger with 3% inflation. Source: Brizo FoodMetrics, February 2025
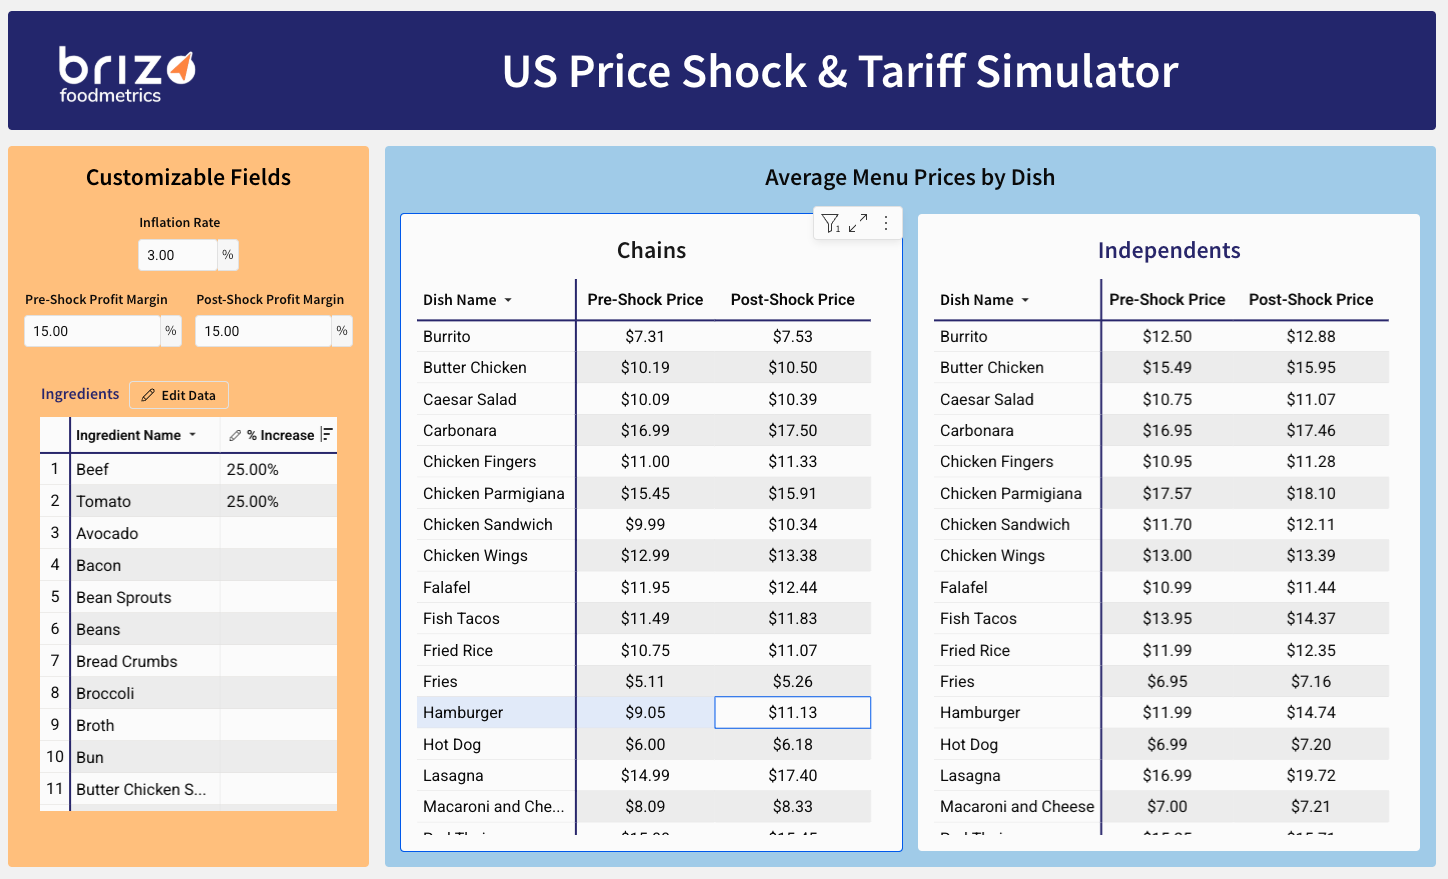
Scenario 1B: Hamburger with 3% inflation + 25% tariffs on beef and tomatoes. Source: Brizo FoodMetrics, February 2025

Scenario 2A: Fries with 3% inflation + 25% tariffs on potatoes and canola oil + consistent profit margins. Source: Brizo FoodMetrics, February 2025
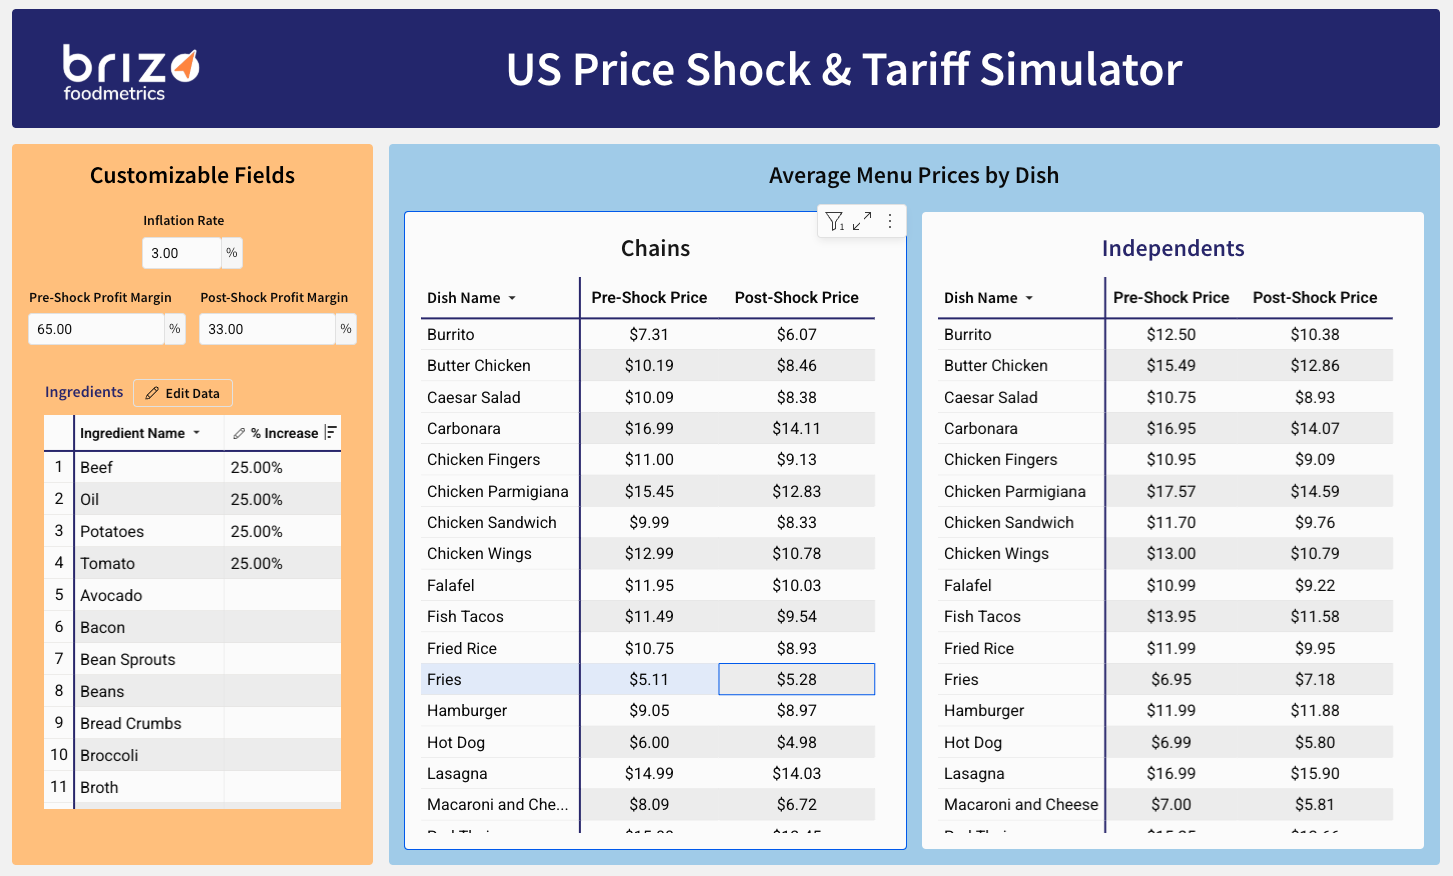
Scenario 2B: Fries with 3% inflation + 25% tariffs on potatoes and canola oil + reduced profit margins. Source: Brizo FoodMetrics, February 2025
Head spinning with the possibilities this simulator opens up? This example is just the tip of the iceberg. With a volley of price shocks hitting the market from all sides — including soaring egg prices, minimum wage increases, looming tariffs, and stubborn inflation — data-driven models are key to being prepared instead of overwhelmed.
At Brizo FoodMetrics, our foodservice data and insights are ready to provide the foresight you need to proactively adapt and stay resilient in a constantly evolving market.
Eager to try it yourself? Request a demo of our predictive model…or get direct access to the underlying market data so you can build your own.
Have another idea? Tell us about it so we can create it for you!
Brizo FoodMetrics equips industry leaders with the actionable foodservice data and insights needed to make informed decisions based on facts, not hunches. Unlock full market visibility, scale business growth, and streamline workflows with large-scale, granular, and up-to-date market intelligence covering over 2.1 million establishments.